Design is functional
Complexity becomes simple at a glance

Our brain processes information in pictures much faster than in text form. The fact is well known. But would you have thought that it happens 60,000 times faster?

Digital reproduction has made editing information a daily ritual for everyone.
Every second we struggle through tons of posts, emails, messages, images. How can one make a meaningful selection from this almost unprocessable wealth of information?

Orientation at first sight.
In the world of finance, lightning-fast information gathering is essential to master complex money movements. Infographics play an essential and at the same time interpretive role there. They translate statistics and information into visual structures very much like pictograms, which summarize complex content in one symbol.
Making ideas visible
Infographics summarize the essentials and thus make a direct contribution in all areas of communication. The design of cleverly designed infographics has become an important part of any good content strategy that promises success.

Animated infographics go one step further.
With an ingenious dramaturgy of movement, the eye can be directed to the particularly important elements and the reader's attention can be directed even more precisely.
3D-Animation for SaarGummi Automotive
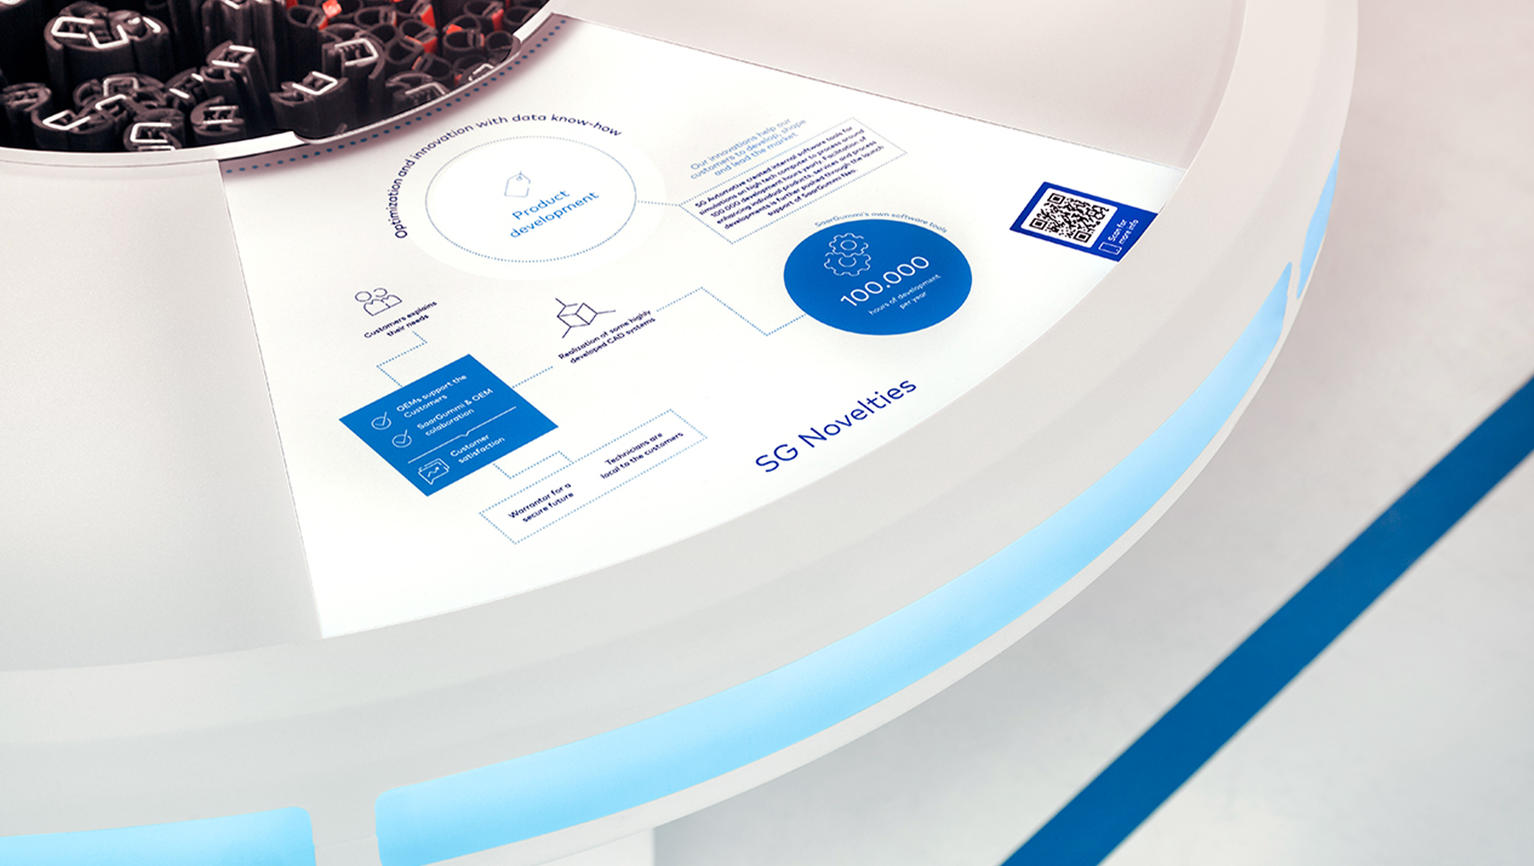
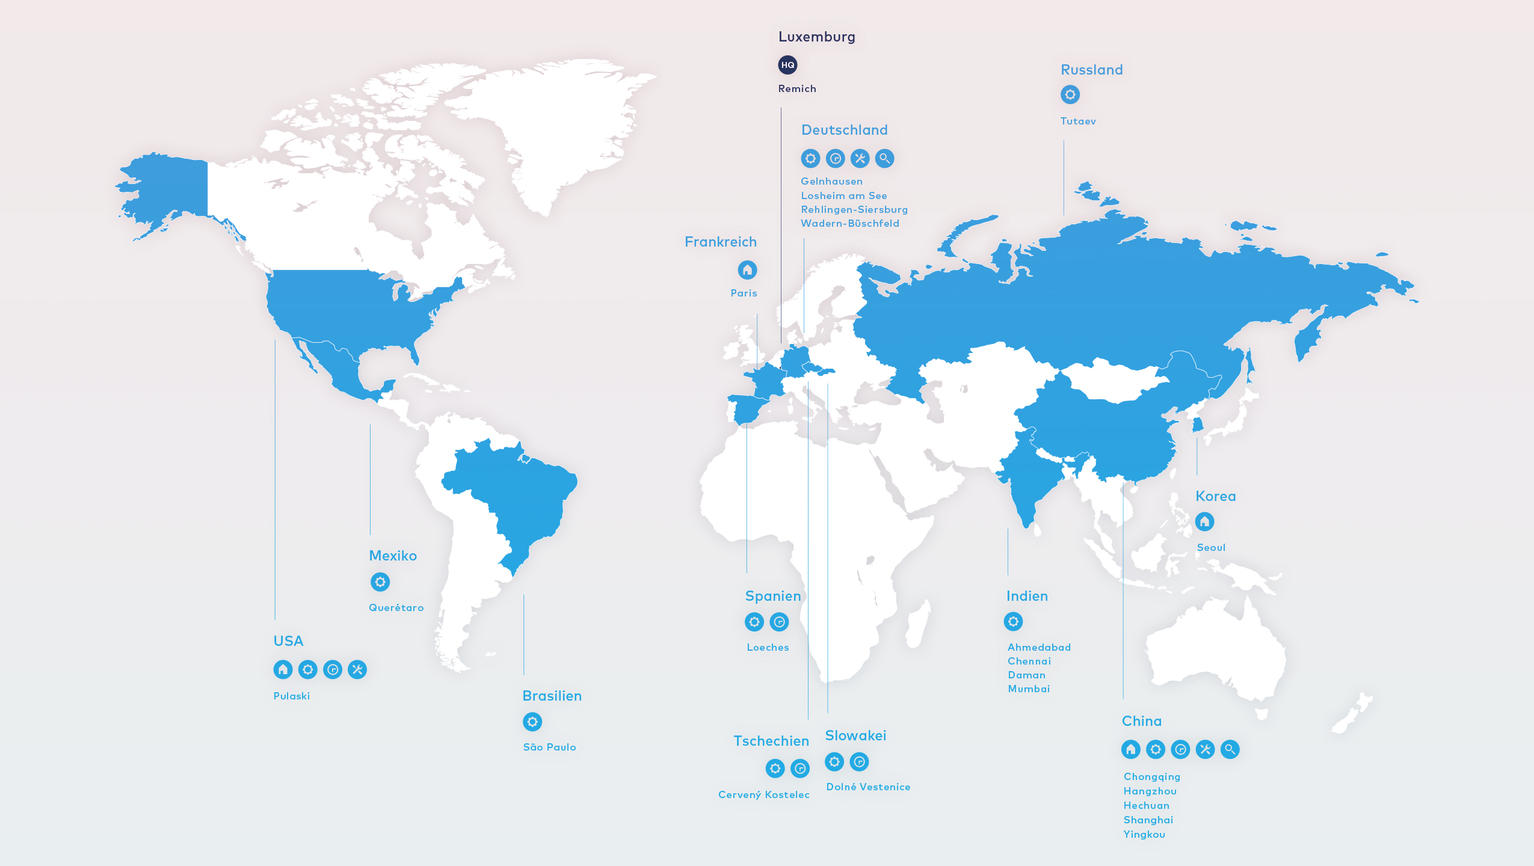
map produced animated 3D graphics for its customers' product range and used this technique to create entire explanatory films. Icons, statistics and text content were transformed into infographics and were mainly used for C-level presentations, websites and internal trade fair appearances.
3D car app
Answered
Answered
When do I need a still and when an animated graphic?
How can complexity be reduced by using an infographic?
When does it make sense to create a 3D model and how do I implement it?
Mapping
Services
Infotainment
Moving
Instruments
User Story Mapping
Process Mapping
Graphic Design
Stories &
Results
Sales process optimized
User experience improved for website, VR & AR applications, presentations, trade shows and other channels


